Advocate Health · Language Access and Interpretation Services
Gateway
Team access to Language Access tools
Authorized team access
Team access to Language Access tools
Authorized team access
Open the Command Center to see today’s numbers, or pick a campus below.
North CharlotteOpen now
South CharlotteOpen now
Opens LAIS AI/SI (live). Other hub tiles stay open.
AI · Lock · Feedback
Productivity = time helping patients ÷ hours worked. Team and region numbers are the average of everyone. Goal 75%.
One Team · One Voice · One Purpose
The goal is not division of turf — it is clarity of purpose, so every patient receives equitable, compliant, and high-quality language access.
Today’s numbers, updated live.
Loading…
Every campus that logs cases · grouped by campus
Today · — / —
Ranked by patients seen · with time logged
Where this comes from: each campus’s case log feeds this page. Every campus is counted on its own.
Tap a location to see who helped
Loading…
Final numbers for the month. Today’s live numbers are in the top card.
Loading activity…
Loading busy hours…
Loading estimate…
See the busiest times and places. Coming soon.
All campuses combined · productivity
Each campus on its own · final monthly numbers · Cabarrus & Winston-Salem not in yet · goal 75%
Advocate Health = all facilities. Ranking & map = per campus. Top card = live cases today. Glow shows activity — it does not change %.
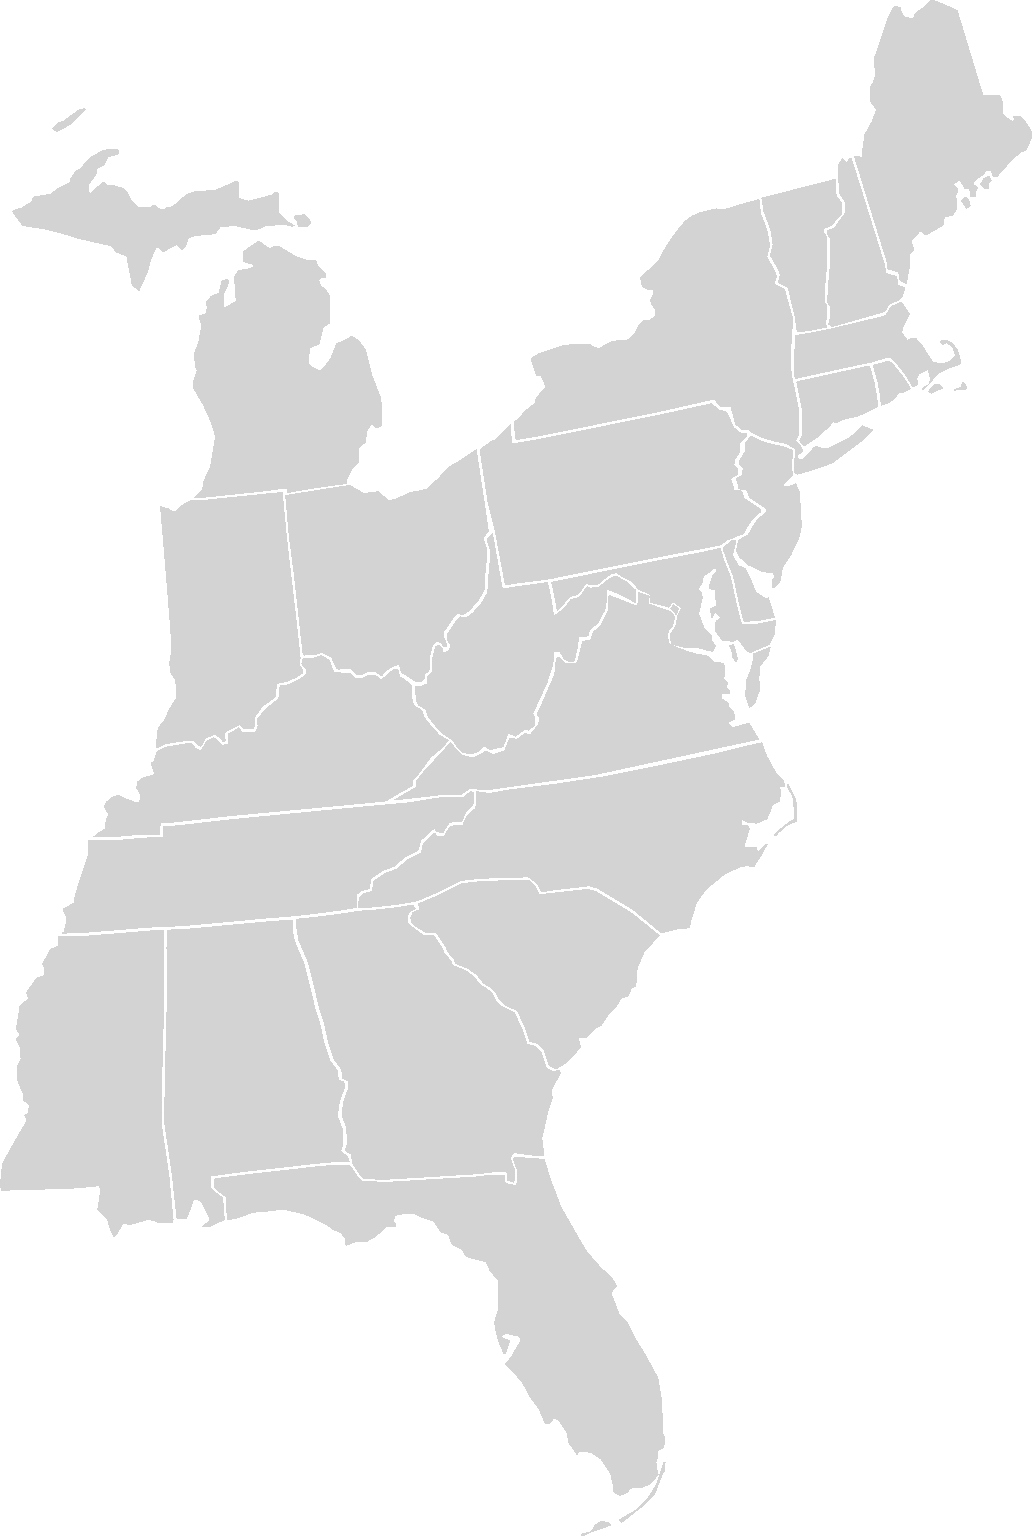
Team totals only — no patient information. The map is a simple drawing, not to scale.
Productivity = time helping patients ÷ hours worked. The team number is the average of everyone on the final list. “Pending” means the numbers aren’t in yet. Goal: 75%.
Loading activity…
Loading busy hours…
Loading estimate…
See the busiest times and places. Coming soon.
| # | Interpreter | Hours worked | Time with patients (hrs) | Productivity % | Contacts | Status |
|---|
—
Loading…
Loading…
Charlotte cases only · patient names masked